Grafana Cloud for Raspberry Pi (RPi-Monitor alternative)

For years I've used the RPi-Monitor app to monitor my Raspberry Pi, but like the torrent client replacement, I'm trying something new this year. I found a solution where we send the data to the cloud instead of storing it locally, which has both advantages and disadvantages.
Advantages compared to RPi-Monitor
- Available statistics from outside the local network
- Nice dashboard and graphs
- Does not take up space on Raspberry Pi
- Only 14 days of history on a free plan
Disadvantages compared to RPi-Monitor
- Temperature monitoring not easy to implement
- You can't monitor your Raspberry Pi without an internet connection
- Monitoring depends on the availability of the Grafana service
Installation
- Sign Up on Grafana Cloud (Free account)
- Go to your custom Grafana dashboard
- Select "Integrations and Connections" from the left menu
- Choose "Linux Server"
- Select "Other Distribution" as an OS
- Run these commands instead of step #3 ones:
cd /home/picurl -O -L "https://github.com/grafana/agent/releases/latest/download/agent-linux-armv7.zip"unzip "agent-linux-armv7.zip"chmod a+x "agent-linux-armv7" - Continue with #4 (there is a copy button, use it)
- Try the agent by running it in the terminal:
./agent-linux-armv7 --config.file=agent-config.yaml - Press "Test integration", and wait a few minutes (be patient)
- If it works, you will see something like that:
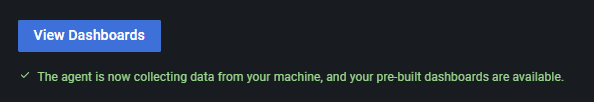
- Check the Dashboard. If you like it, let's continue
- Create a user for Grafana Agent
sudo useradd --no-create-home --shell /bin/false grafana-agent - Create service file
cat <<EOF > /etc/systemd/system/grafana-agent.service[Unit]Description=Grafana Agent[Service]User=grafana-agentExecStart=/home/pi/agent-linux-armv7 --config.file=/home/pi/agent-config.yamlRestart=always[Install]WantedBy=multi-user.targetEOF - Start and enable the service
sudo systemctl daemon-reloadsudo systemctl start grafana-agent.servicesudo systemctl enable grafana-agent.service - That's all, done.


Comments